
Paul Park: Forecasting Retail Sales
Data
The US Census website has a lot of interesting data to play around with. I wanted to try some forecasting and decided to look at retail and food service sales. Sales data ranges from January 1992 to June 2015, and the data was added to a pandas dataframe, which was then plotted below:
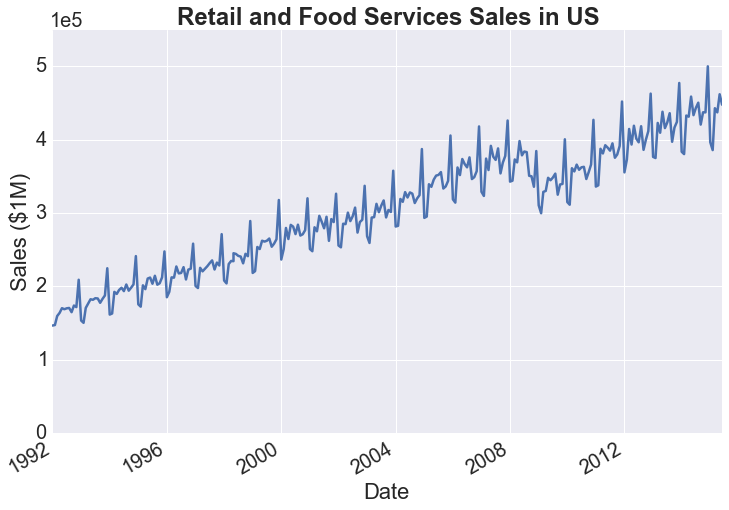
There is a linear trend in the time series along with seasonal patterns that need to be accounted for when we attempt to forecast sales. Another feature that is of interest is the drastic dip that occurs between 2008 and 2009 most likely due to the subprime crisis.
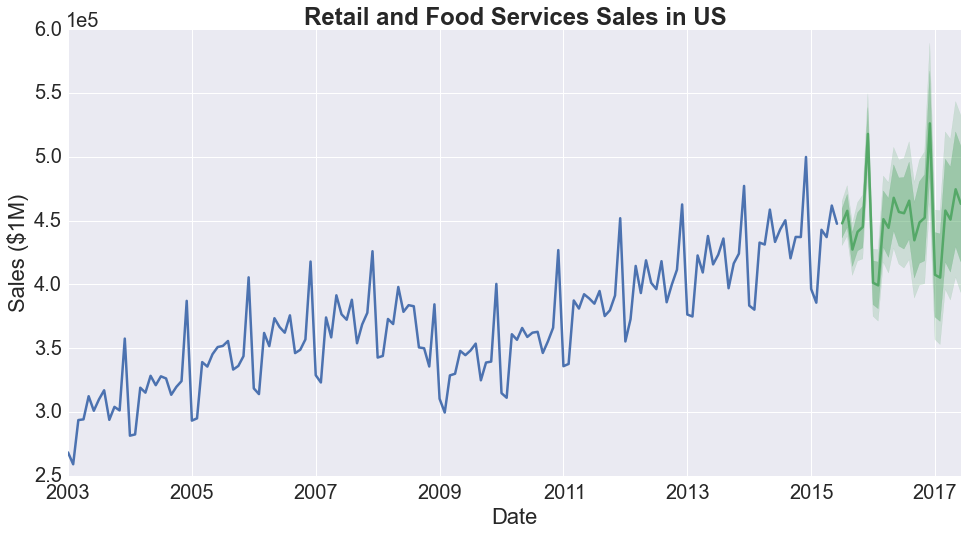
After struggling to forecast using Python's existing packages, I decided it might easier to call on R from Python using rpy2 because R seems to have a more extensive and well-documented library for forecasting. It didn't take me long to decide that it might be even easier to clean the data in Python, save the data as a csv file and then import it to R to do the forecasting. The plot below uses an ETS model (exponential smoothing state space model - the acronym doesn't make sense to me at the moment) with a multiplicative error, additive trend, and multiplicative seasonality. The forecast is in green, with the different shades indicating a 80% and 95% confidence interval.
Next Steps?
- There were two things that I wanted to capture in my forecast, trend and seasonality. I need to have a better understanding of how the ETS model works.
- It would be interesting to see if the forecast and confidence intervals from data up to 2007 includes the financial crisis that follows.